
Media & Strategic Communication Department
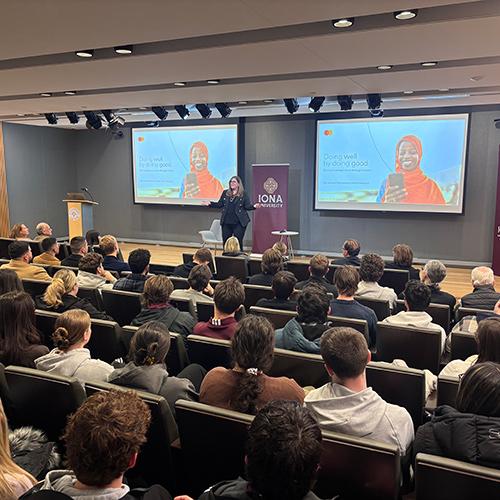
As individuals we consume media at a rapid pace from all directions. TV news segments, radio programs, social media, blogs, podcasts, billboards... the list goes on and on. In order to stand out from the masses, media needs to be strategic, engaging and effective.
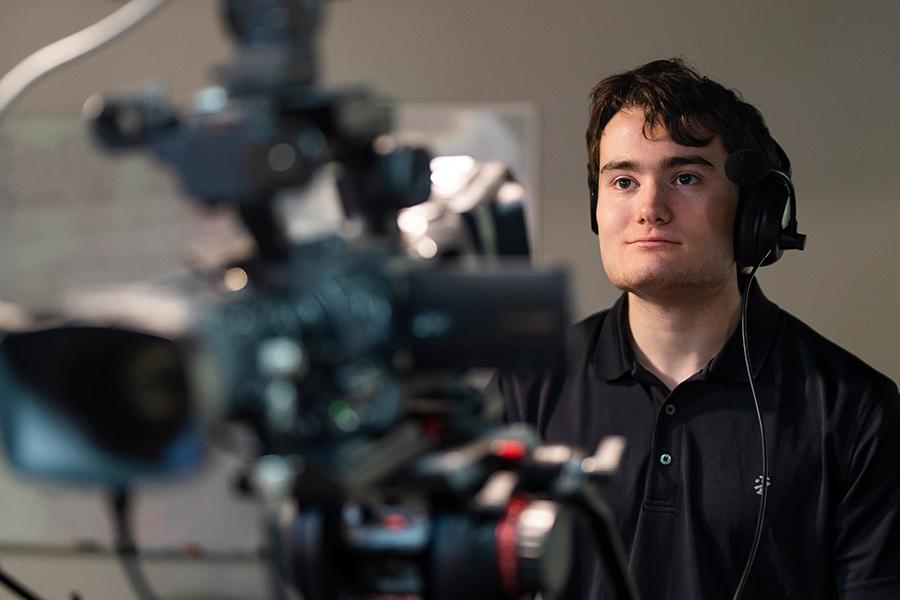
Our Media & Strategic Communication Department will show you how have to craft your art, and set you on the path for an exciting media career – whether in broadcast, advertising, public relation or journalism.
Develop the skills to be a creative and analytical storyteller. Ignite your passion to engage others and strive to discover the truth. Hone your ability to present information in compelling ways across multiple media platforms.
You will learn alongside industry professionals, navigating the art and science behind strategic communications. You will gain hands-on experience through extensive internship opportunities in New York City –the media capital of the world.
You will be prepared to master the world of media.

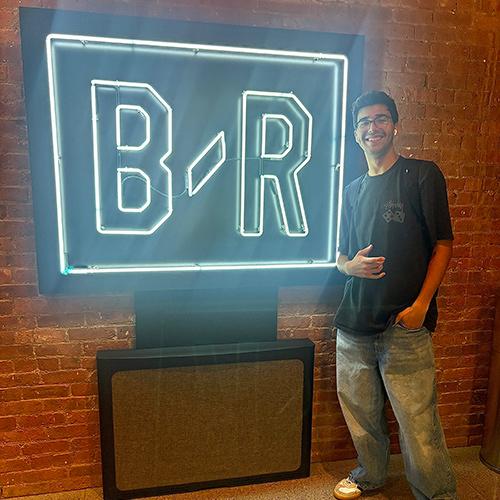
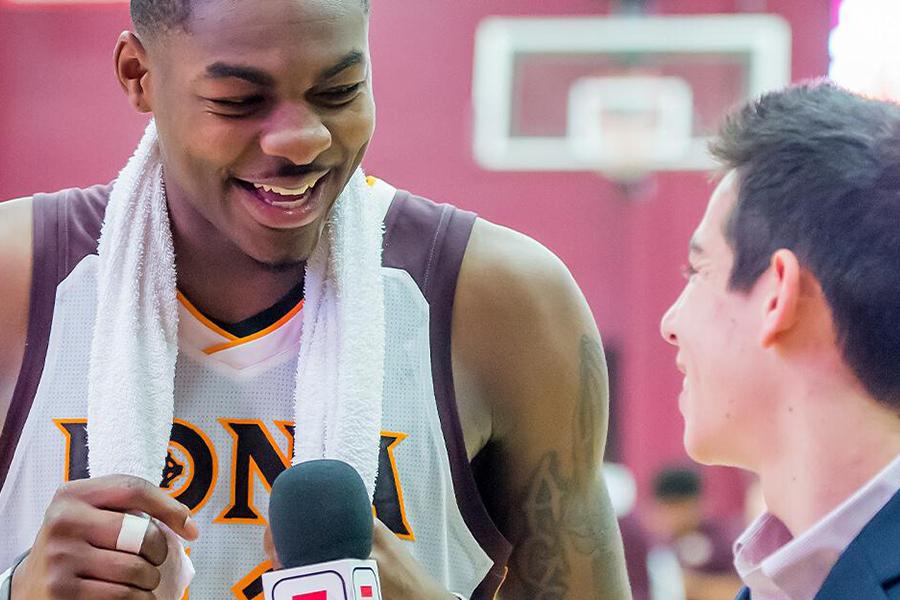
I was in the field, covering breaking and national stories. My Iona education translated into real-world scenarios.
-Ava Palladino ’25, Fox News Media "Spotlight Intern"
Read More about Ava

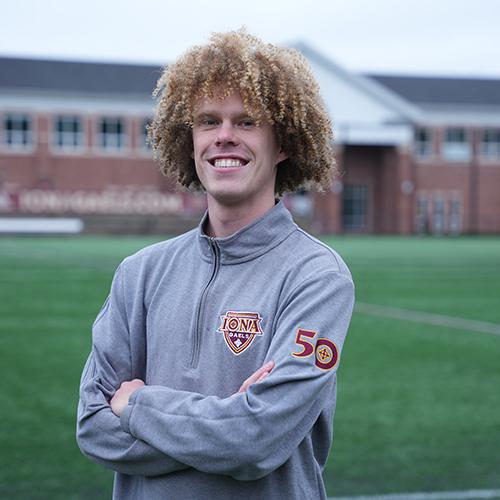
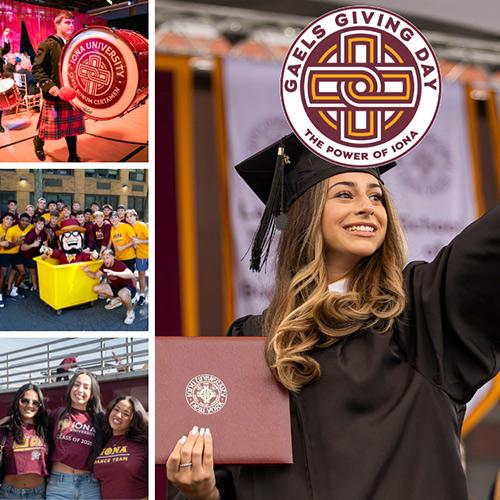
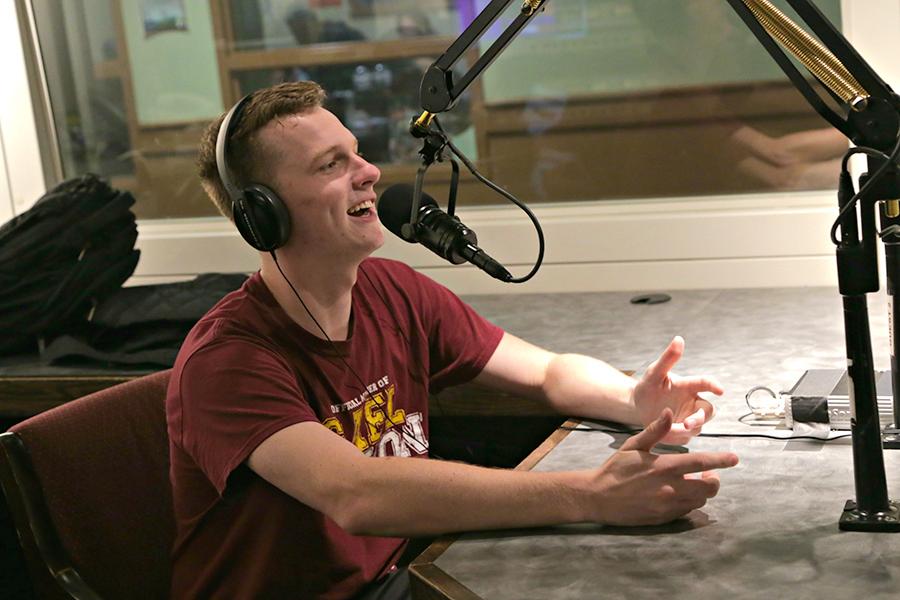
I had the opportunity to film a March Madness game live in front of 14,000 people and perform with the Iona Singers at Radio City Music Hall. These are once-in-a-lifetime opportunities that Iona has made possible for me.
- Ryan Murphy ’25, Media & Strategic Communication Major
Read More about Ryan
Iona University Welcomes Emmy Award-Winning Sports Anchor Bruce Beck as Executive-in-Residence
Beck will serve as a mentor and resource for students in Iona’s Sports Communication & Media Graduate Program helping them to "improve their skills now and define new opportunities for the future."


Iona is committed to connecting students with real-world experiences and keeping the community alive. I instantly realized how at home I felt here.
-Elizabeth Riccio ’26, media & strategic communication major
Read more about Elizabeth
The mission of the Department of Media & Strategic Communication is consistent with the goals of Iona University in the traditions of the Christian Brothers and American Catholic higher education. The Department is committed to balancing the need to educate majors who possess the skills to succeed in media & strategic communication careers with the need to be faithful to the time-honored liberal arts education. We prepare our students to meet the challenges and opportunities of the digital age and to become skilled ethical decision-makers and critical users of media.
The Department continues to enhance its reputation of excellence regionally, nationally and internationally with a focus on diversity, life-long learning and the individual attention that is characteristic of the Iona education. We promise that our students will be well prepared, sought after by the media & strategic communication industry and deeply proud of their Iona degrees.
(Revised, January 2013)
- Individual professions in journalism and media & strategic communication may require certain specialized values and competencies. Irrespective of their particular specialization, all graduates should be aware of certain core values and competencies and be able to: understand and apply the principles and laws of freedom of speech and press, for the country in which the institution that invites ACEJMC is located, as well as receive instruction in and understand the range of systems of freedom of expression around the world, including the right to dissent, to monitor and criticize power, and to assemble and petition for redress of grievances;
- demonstrate an understanding of the history and role of professionals and institutions in shaping communications;
- demonstrate an understanding of gender, race, ethnicity, sexual orientation and, as appropriate, other forms of diversity in domestic society in relation to media & strategic communications.
- demonstrate an understanding of the diversity of peoples and cultures and of the significance and impact of media & strategic communications in a global society;
- understand concepts and apply theories in the use and presentation of images and information;
- demonstrate an understanding of professional ethical principles and work ethically in pursuit of truth, accuracy, fairness and diversity;
- think critically, creatively and independently;
- conduct research and evaluate information by methods appropriate to the communications professions in which they work;
- write correctly and clearly in forms and styles appropriate for the communications professions, audiences and purposes they serve;
- critically evaluate their own work and that of others for accuracy and fairness, clarity, appropriate style and grammatical correctness;
- apply basic numerical and statistical concepts;
- apply tools and technologies appropriate for the communications professions in which they work.
Contact Us
Media & Strategic Communication Department
Mitchell T. Bard, Ph.D.
Department Chair
(914) 633-2459
mbard@iona.edu